“Hey Mr. [pickupsportstalkcle]! Tell me where have you been? Around the world and back again…”
I last posted on this little corner of the internet that I own five years ago. I have to be honest, I was shocked when I went to the homepage a moment ago and saw the dateline on my last post was August 7th 2020. I just so happen to be sitting here beginning to type this new return post on August 7th 2025, literally 5 years to the day later. I didn’t plan it this way.
In a way though, what lays below is kinda neat. I encourage you to scroll down and see what I was writing about five years ago. It is like a time capsule. Baseball hadn’t quite returned from the COVID delay yet. I started what I had planned to be a recurring segment about much maligned Cleveland relief pitchers of the past (the Gasoline Gang!), never to return to the subject. There’s an NBA playoff plan in there for the upcoming bubble. All these things feel so quaint now. It is so easy to lose track of how time changes the world when you’re living in it every day. I don’t mean to make this deeper than it needs to be because all I’m really doing is prattling along on me keyboard about sports, but the world has significantly changed since the last time I hit the submit button on this site.
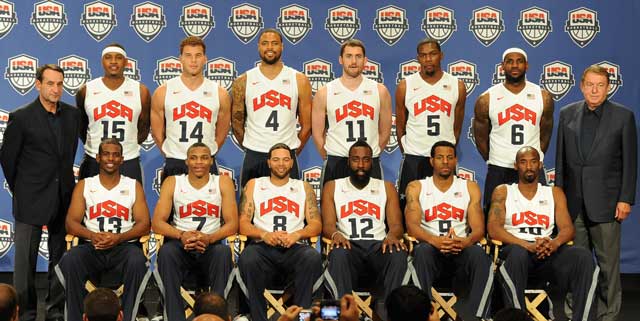
So, what happened? Why, after making pretty consistent contributions to this page back in 2020, did I suddenly just drop off a cliff? Did the return of sports in the weeks that followed my last post distract me? Did the games returning satiate my boredom and leave me no reason to type away about USA Basketball teams or Cleveland baseball alternative histories?
If you’re reading this now, there’s a decent chance you know better than that. The fact of the matter is that while I did stop writing here, for the vast majority of the last five years, I didn’t stop writing altogether. Many of you followed me on that journey and I appreciate it. I know my following isn’t large. Mostly friends and family, but all the same, thanks for clicking on this.
I hope I won’t bore you to death, but I just feel like I need to write out how I’ve made this giant circle back to this space. Next time I get back on here, we can get back to the more traditional conversation. I promise it won’t be another five years. Before we can get to the part when I stopped writing here though, I think I just want to start at the beginning.
I remember sitting in my apartment with my now-wife several years ago. I don’t remember exactly when, but it was probably around 2017 or 2018. We were just lounging. I had been watching the Indians’ game that had just ended and we hadn’t decided what we were going to do next. The post-game show was on and Al Pawloski and Jensen Lewis were recapping the happenings of the day. Without prompting, my wife expressed to me something along the lines of “How do you get a job doing what they (Al and Jensen) do? You could probably do that.”
I’d like to think in some small way she was right. Perhaps I am still kidding myself all this time later, but while I do have a Sport Management degree, I never went to broadcast school like Mr. Pawloski and I never played in the bigs or had biceps the size of Jensen Lewis’s. It was a nice thing for her to say, because I am a baseball/sports fanatic and think I do know what I’m talking about to an extent, but I shrugged it off at the time. If anyone is going to believe in you like that, it should be your future wife, but that doesn’t make it a reality.
I also remember sitting in my old work office downtown. This was definitely in 2019. A good friend and co-worker of mine was establishing himself as an IT professional at the time, and like many things in his life, he had jumped into it head first. That isn’t a slight, by the way, he’s an accomplished IT manager now, but all the same, when this guy gets the itch to start a new task or hobby, he tends to do it to the fullest extent.
Anyway, this friend of mine came into my office that day. I don’t remember the entire context of the conversation, but what I do remember was that he was very excited because he was just started a YouTube channel dedicated to IT tutorials. Like I said, he was full-go on IT. He had the itch and was going to use his new found skills not just for work, but to start a personal project and make some media on the side.
From here, I forget all the details, but I imagine that after telling me about his channel our conversation invariably turned to sports and I likely was going on some tangent about one of Cleveland’s teams. What I do remember though was that my friend said something like, “You should make your own sports blog,”
To be fair, I would have considered this individual my friend back then when he said this, but we weren’t as close as we could get in the coming years as we both matured professionally and worked our way up at the company at which we were working. It meant something to me when my wife said I should be making some sort of sports media, but it meant even more for him to say, because he has less reason to talk me up.
I did have both of their compliments reverberating in my head though. I had a good job at the time (still do, but more on that later). I wasn’t necessarily looking to risk it all and leave it all behind to get myself on ESPN or something, but I think a sense of maturity and confidence that I didn’t have when I was younger (and may have told me to check out broadcasting when I was in school, perhaps) told me that it wouldn’t hurt to look into what it costs to own your own web domain.
It turned out that at the time buying a WordPress domain cost about $60 a year. That’s about the same as a game for my Playstation 4 would have cost. Knowing that and after a little more consideration, I decided to give it a whirl. Why not? What do I have to lose?
And for the next ten months or so, I had a blast creating on here, but as I was doing it, I also felt the need to be networking. Reddit is my social media of choice. Please don’t judge. I like that fact you subscribe to topics as opposed to people and it is essentially a forum.
Reddit would also be a great place to post my articles if it wasn’t for the fact that self-promotion is so frowned upon there, but I did find a sports-blog sub that allowed people to post their own work. And that subreddit is where I met a gentleman by the name of Vince Quinn. Vince was working in sports talk radio in Philadelphia at the time and was starting his own blog and podcast website. He jumped on the subreddit asking questions that I didn’t have the answers for (SEO was a topic, I remember) but he and I hit it off in DMs about our specific projects and he told me he was hiring a group of writers for his site. He saw some of my work and asked if I was interested.
And THAT is why my work tapered off here at PUSTCLE. Well… partially. I started working with Vince in the spring of 2020, which was also around the time that my day-job career started taking off. I had been asked if I wanted to step into a management role right around the time that Vince asked if I was interested in writing for his site.
For about four or five months I managed to juggle it all, writing MLB-based posts for Vince (Triple Play and then Last Out Media) while still putting everything else on this page until this fell by the wayside in the summer. I genuinely enjoyed my time writing for him. I was a bit of an outsider in that most of his writing team was based out of Philly, but those were a really great group of people that made me feel welcome and supported my work (shout out to Francisco Rojas, who invited me on his YouTube channel and is still going there today).
Unfortunately though, Vince and the small group who were in on the project with him decided their future was in the podcasting side of things more than the blogging or writing side. They closed the blog down a little more than a year after I joined. I kept contact with some of that old writing group for a while. They started their own Substack and I think I posted a thing or two on it, but I was feeling the itch to be able to write about my local teams and wanted to find a new platform.
And about that time I got Zach Shafron’s attention. Zach operates Cleveland Sports Talk, a fan site for Cleveland sports. He was in need of Guardians writers at the time and I was happy to make that my specialty. CST ended up being the site where I would have the longest tenure. I believe I was there for more than three and a half years and I know I contributed more than 100 posts about the Indians/Guardians during my time there. Some of my favorite work, like my article about how the Indians turned a $3000 signing bonus given to Bartolo Colon into several star players over time is on that site. He was great to work with, helped come up with ideas and would occasionally challenge me to write on topics that I otherwise would not have written about.
Over time though, I felt a little bit pigeon-holed writing about just the Guardians. I am sure that if I had talked to Zach about branching out he would have let me. More importantly, Zach required three posts a month from his writers. That is in no way a ridiculous or unreasonable request, but that management job that I was working in the day was growing and growing.
Setting aside writing, that day job had grown to be too much. I want to be careful with how I say this. It wasn’t that there was any individual piece of the job that I felt like I couldn’t do. It was that there were so many individual pieces to the job.
I’m not here for anyone to feel bad for me. Many people out there work longer hours than I did. Many of them have to in order to survive. But, I was working consistent 50-55 hours weeks- five full work days plus a couple hours of work on Sundays. This wasn’t once in a while. This was every week, week after week. I feel like I’m generally an optimistic and pleasant person to be around, but I know my moods grew more frustrated and irritable. I was stressed and quicker to be negative. I wasn’t being me.
It didn’t seem like the expectations of my employer were going to change any time soon. I remember driving home after one long day at work, sitting in the car in silence and asking myself why I was doing this to myself. The only word that popped into my head was: “money”.
Again, I understand that for some, that would be more than enough reason. I am talking from a place of privilege. But, I decided that if my employer wasn’t going to change their expectations, it was time to find a new employer. I needed to choose myself and while I didn’t want to go broke, I would be willing to concede some earnings for the right work-life balance.
And I was serious about my decision to the point that I knew that I was going to have to set aside writing for a while. That was a big deal for me. Over those four years I had been telling myself that even if I was frustrated with work, I wasn’t going to let it not allow me take the time to do something I enjoy like writing. But at that point, I knew I needed to focus on finding a new job so that hopefully I could return to writing without feeling the stress to fit it in. I just wanted to be in a better overall state of mind.
So, I reached out to Zach and let him know I had to step away. Given the fact I did it during the Guardians’ season, I am thankful for how smoothly he took it (I know it was a free fan site, but still). My goal was to go full bore into a job search. And that’s what I did, except I did get distracted.
This spring I was browsing around Reddit again and stumbled on a post in the Guardians’ subreddit. This post came from a Twins fan (a brave soul) who had an idea for a podcast he wanted to put together. The idea was to take a fan from each of the five American League Central teams and do a weekly recap show about the division.
I had literally just committed myself to my job search, but the idea of podcasting had been on my mind for a while. At the same time, I knew that I did not have the knowledge or skills in order to administer or carry on air my own podcast. An ensemble cast type of show was exactly the type of thing I would be interested in. I couldn’t risk that another opportunity would come up in the future, so I reached out to that Twins fan.
He goes by the name of Eric and now he, myself, Lee from Detroit and Sam from Kansas City get online and talk about our teams once a week. I am fortunate in that the podcast isn’t a one person show in the way my writing is. I do all my own editing in my written work and I am finicky about it so it takes some time. The fact that I just need to do a bit of research the day before and then show up for the show for two hours was a huge boon that allowed me to keep creating while looking for a job.
Which brings me to now. Exactly one month ago, I started a job with a new company. I’m not just a little stitous; I’m entirely superstitious and don’t want to say too much positive about the new place because of that. But I will say that I am putting in an honest full work day that I can be proud of while not feeling the grind and stress I felt at my old employer. Things are looking up.
And this week, I got another itch. I got the itch to start writing again. So, I’ve been sitting here putting this together for the last couple of hours. I really enjoyed my time writing on CST, but I’ve decided I want the freedom to post as frequently or infrequently as I want. I am going to keep it to sports, but I also want to be able to write about whatever sport that I want. The Guardians and Cavs and their respective leagues will remain my bread and butter. I will continue my informal “no Browns/NFL” policy, but I’ve expanded my sports palate a little in recent years. The WNBA and NASCAR are probably as far on opposite sides of the cultural spectrum as possible, but I like them both. You might seem a little something about them at some point. My Columbus Blue Jackets’ fandom has waxed and waned in the last half decade based upon how accessible their games are for me on television. They very well may make an appearance as well here.
I’m sure Zach would probably be flexible with me and willing to work with me, but more important than post schedules and content, I just am at a point where I want to be entirely in control of what I put out and when. It is about comfort and it is about being accountable to myself and myself only in this little hobby I’ve developed over the last five years.
That’s why I’ve written this today. I guess this is a bit of a journal or diary entry more than anything else. If you’ve made it this far, thank you for reading, both in this post and over the last five years.
When I first started doing this, I cared more about if I was getting views or not. I don’t want to do that now. That sentiment was coming from a place of insecurity about spending my time on writing in the first place. Don’t get me wrong, it is nice to know that people are looking at my posts, but I’m not going to consider my writing more or less worthy based on view counts. I wrote this today for me. There is a sense of perspective in my family, friends, work and hobby life all mixed in to what I just recapped. It felt good to put together. It was fun. That’s why I want to do this again. Fun.
So, I am going to dust off my little corner of the internet here and you’re welcome to join me. Whether there’s zero, one or one thousand of you- let’s have some fun.


